In distributed systems, network reliability is often taken for granted until something goes wrong.
While we frequently discuss the theoretical unreliability of networks, our experience shows that the overwhelming majority of network issues stem from misconfigurations – rather than actual infrastructure failures. It is also often hard to prove that a network outage stemmed from a cloud provider if you don’t have real-time observability into the network.
In this post, we'll share how we improved network observability in CockroachDB Cloud by implementing a dual-approach monitoring system called Network Inspector. We'll discuss how it works, and its impact on our ability to detect and resolve network issues before they affect our customers.
Before: Network performance monitoring issues
Before implementing Network Inspector, we relied solely on the health of the CockroachDB database to gauge network performance. This approach was reactive in nature, because network issues were only identified after they had already impacted the cluster.
In many instances, the network was degraded for several hours, but these issues only became apparent when CockroachDB nodes restarted and failed to recover properly due to underlying network problems. This made the mitigation reactive rather than proactive.
In addition to proactive monitoring, Network Inspector's secondary goal is to assist in debugging network-related incidents. Attributing CockroachDB health issues to underlying infrastructure’s network disruptions is often challenging, and a tool designed to offer a detailed enumeration of various network health metrics was needed. This enables on-call engineers to confidently start their network investigations and pinpoint the source of disruptions more effectively.
A dual approach to network monitoring
Our solution, Network Inspector, combines two complementary approaches to network monitoring:
1. Proactive network probes
The first component is a proactive probe that continuously monitors two critical aspects of network health:
DNS Health: The probe issues DNS lookups designed to test each Network Inspector service across regions.
Pod-to-Pod Connectivity: A rate-limited ping emits from each probe pod to every other probe pod across regions.
The probes run as a Kubernetes DaemonSet, with an agent on each node in the cluster. A Kubernetes Headless Service enables agents to discover each other and begin probing immediately after startup.
2. Network observation via Hubble
We also integrated Hubble, a tool that enriches network metrics with contextual labels. By monitoring the drop metric, we can track and understand packet drops between pods, which helps diagnose network performance issues in real-time.
Implementation details
The Network Inspector implementation focuses on two primary areas where we've seen the most network-related issues:
DNS monitoring
The probes resolve networkinspector.<region>.svc.cluster.local using the Kubernetes backbone to mimic the CockroachDB pod dns resolution.
The networkinspector, being a headless service, resolves the host to the networkinspector pod IP address, which is later used for checking pod-to-pod pings.
# service.yaml
# set ClusterIP as None for a headless service
ClusterIP: None
Pod-to-pod
Probes use the host network backbone for pinging the pod IPs, which helps us detect cloud provider-side outages. Limiting the number of pings in a fixed interval allows the probes to scale with the number of regions added.
# daemonset.yaml
DNSPolicy: ClusterFirstWithHostNet
Hubble metric
Enabling the drop metric with context allows us to know between which pods the packets were dropped.
# cilium.yaml
hubble-metrics:
drop:destinationContext=pod;sourceContext=pod
Impact
How these probes helped uncover network related issues
Single CoreDNS deployment
During routine monitoring of our network, we noticed a pattern of errors in our probes during one specific incident. These errors prompted further investigation by Cockroach Labs engineers.
When Cockroach Labs engineers investigated the probe errors during one particular incident, we were able to determine that the CoreDNS pod was not scaling when the cluster was scaled from single node to multi-node. The node containing the single CoreDNS was churned, causing the probe to fail thereby alerting the engineers which led to this discovery.
Visualizing the telemetry
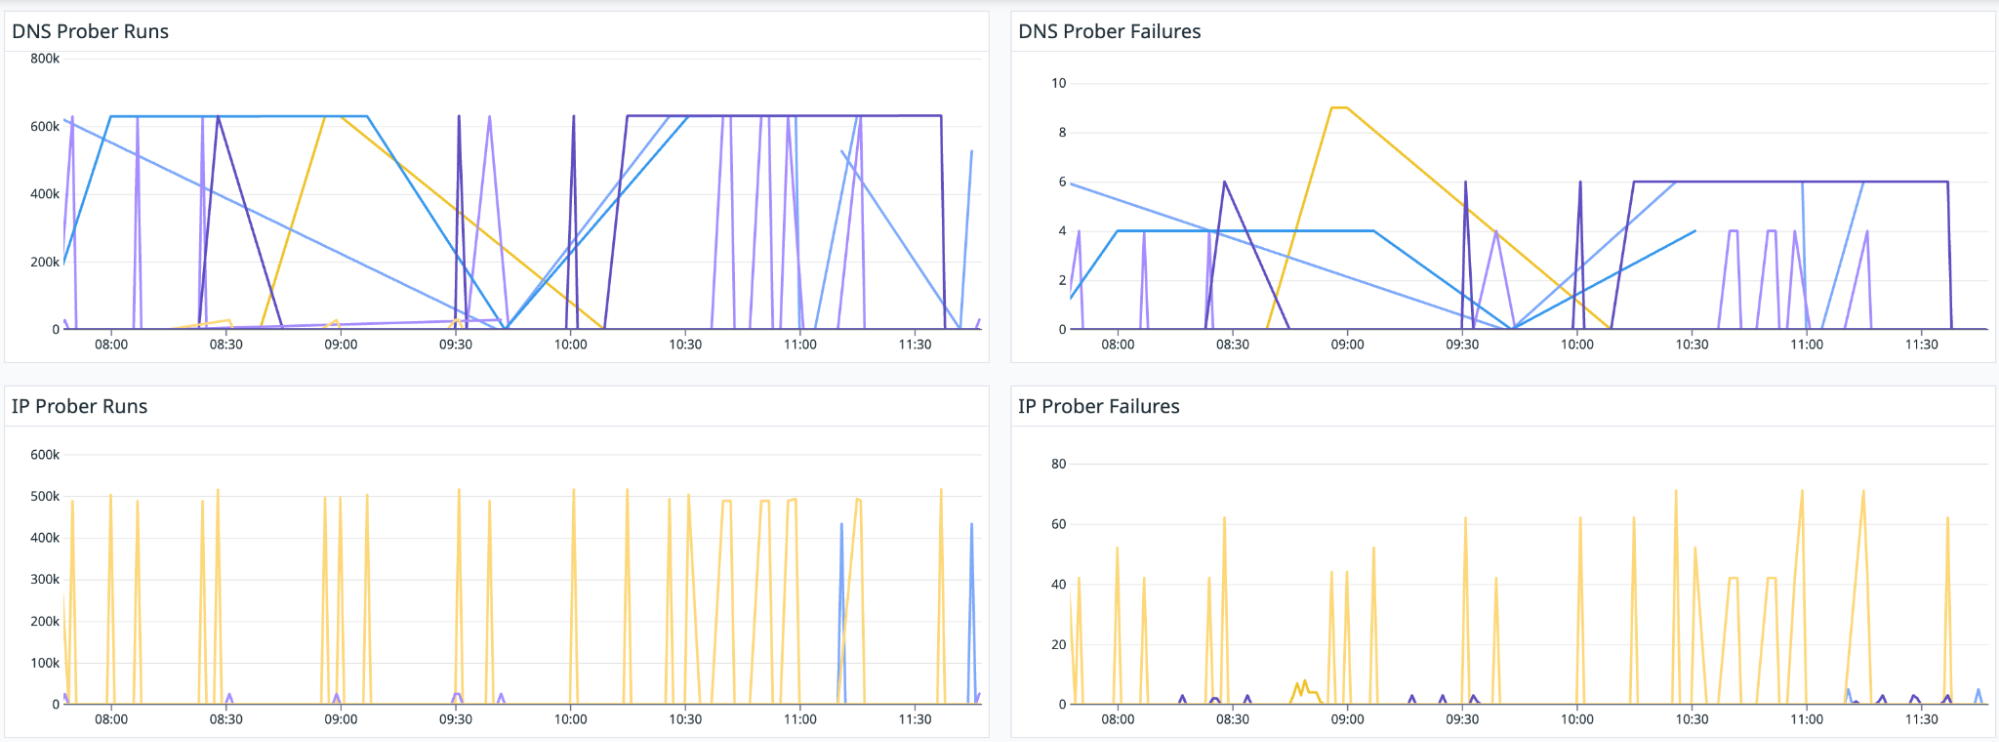
Runs and failures
We have metrics for the actual probes being run and the number of failures observed:
Latencies
These depict the time taken to resolve the host name(DNS probe Latency) and time to probe the IP addresses of the pods (Pod Probe Latency):
Logs
These are the pod logs that help with the debugging when failures are observed in the probes:
Packet drops
This Hubble metric gives insight into why the packet was dropped and what was the source and destination of the packet:
A better view of network health
By combining proactive probing with passive observation, CockroachDB Cloud’s Network Inspector has given us unprecedented visibility into our network health. The solution's layered approach allows us to detect issues before they impact customers, while providing the detailed metrics needed for quick problem resolution.
The key takeaway is that in modern cloud environments, network monitoring shouldn't rely solely on application health checks. A dedicated network observability solution can catch issues earlier and provide the context needed for quick resolution when problems do occur.
Get started today with CockroachDB Cloud at https://cockroachlabs.cloud/signup.
Vishal Jaishankar is a Site Reliability Engineer at Cockroach Labs.


