Building mission-critical applications on CockroachDB demands robust observability. In complex, microservices-oriented architectures, it can be especially hard to correlate activity and pinpoint problems between different application services and the database layer. Each microservice might execute numerous SQL queries but traditional database monitoring tools often provide only a query-centric view. The impact: You get a disconnect between slow queries and the application component(s) that are responsible.
When an issue arises, say a spike in query latency, engineers often lack clear signals that tie the database-level symptoms back to the specific service, route, or feature in the application to employ the appropriate mitigation. Without that end-to-end context, troubleshooting can feel like searching for a needle in a haystack.
Why database observability breaks down in microservices architectures
Imagine a payment service and an adhoc analytics service are both accessing your database. If you observe high CPU usage or slow queries in the database, how do you quickly tell which service (and which code path) is causing it?
You could dig through logs or trace IDs manually, but what’s really needed is a way for the application to identify itself in the database workload. In other words, we want to tag database queries with application context, enabling end-to-end tracing from the application layer down into the database layer. This kind of linkage is critical for preventing issues (by understanding usage patterns), tuning performance, and rapidly troubleshooting incidents in distributed systems.
How query tagging brings application context into database observability
To close the observability gap, CockroachDB now supports query tagging via SQL comments, bringing application-level context directly into database monitoring. This feature follows the open-source SQLcommenter specification, part of OpenTelemetry, which defines a vendor-neutral format for attaching key=value metadata to queries. CockroachDB recognizes these tags and incorporates them into its observability stack.
Query tags can carry rich application metadata such as service names, route handlers, user IDs, or feature flags. Embedding this information and persisting them from SQL comments lets the database correlate performance issues or errors with the precise application state or code path that triggered them. For example, if a query experiences latency, tags can reveal the exact microservice, user action, or API endpoint involved.
Here’s an example of a tagged SQL statement:
SELECT
 c.org_id,
 c.email,
 COUNT(DISTINCT o.id)                              AS orders,
 SUM(oi.qty * oi.price_cents)                      AS spend_cents,
 ROUND(SUM(oi.qty * oi.price_cents) / 100.0, 2)    AS spend_usd,
 MAX(o.order_ts)                                   AS last_order_ts
FROM demo.orders      AS o
JOIN demo.customers   AS c  ON c.id  = o.customer_id
JOIN demo.order_items AS oi ON oi.order_id = o.id
JOIN demo.products    AS p  ON p.id  = oi.product_id
WHERE
 o.order_ts >= now() - INTERVAL '30 days'
GROUP BY c.org_id, c.email
ORDER BY spend_cents DESC
LIMIT 20
/* framework='fastapi', endpoint='GET /v1/reports/top-customers',
  db_driver='asyncpg', orm='SQLAlchemy', service='reporting',
  tenant='org_name_tenant', org_id='org_name', user_id='u_901',
  traceparent='00-4bf92f3577b34da6adfhd49d0e0e4736-00f067aa0ba902b7-01',
  feature_flag='reporting_v2', version='2025.9.2' */;
CockroachDB surfaces these tags across key observability touchpoints:
Logs and Tracing – Tags appear in logs and trace spans (prefixed with querytag-), providing context during debugging or incident analysis.
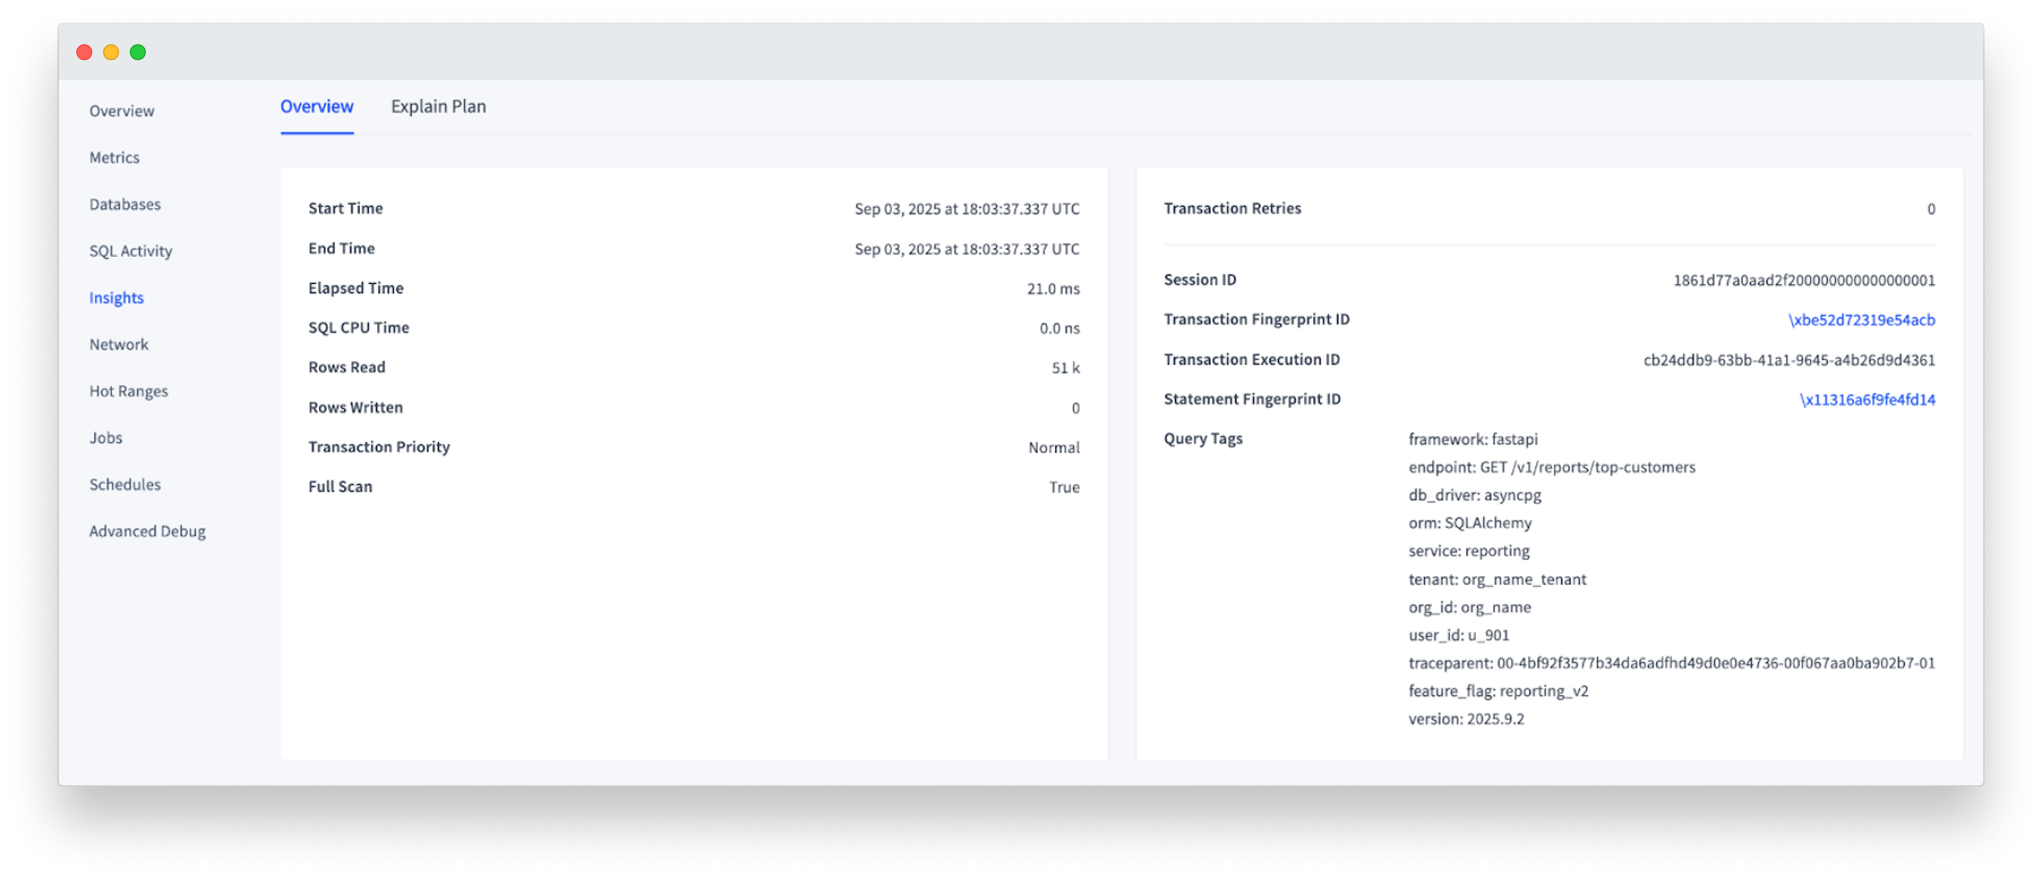
Execution Insights – Tags are stored in the cluster’s execution insights for historical analysis.
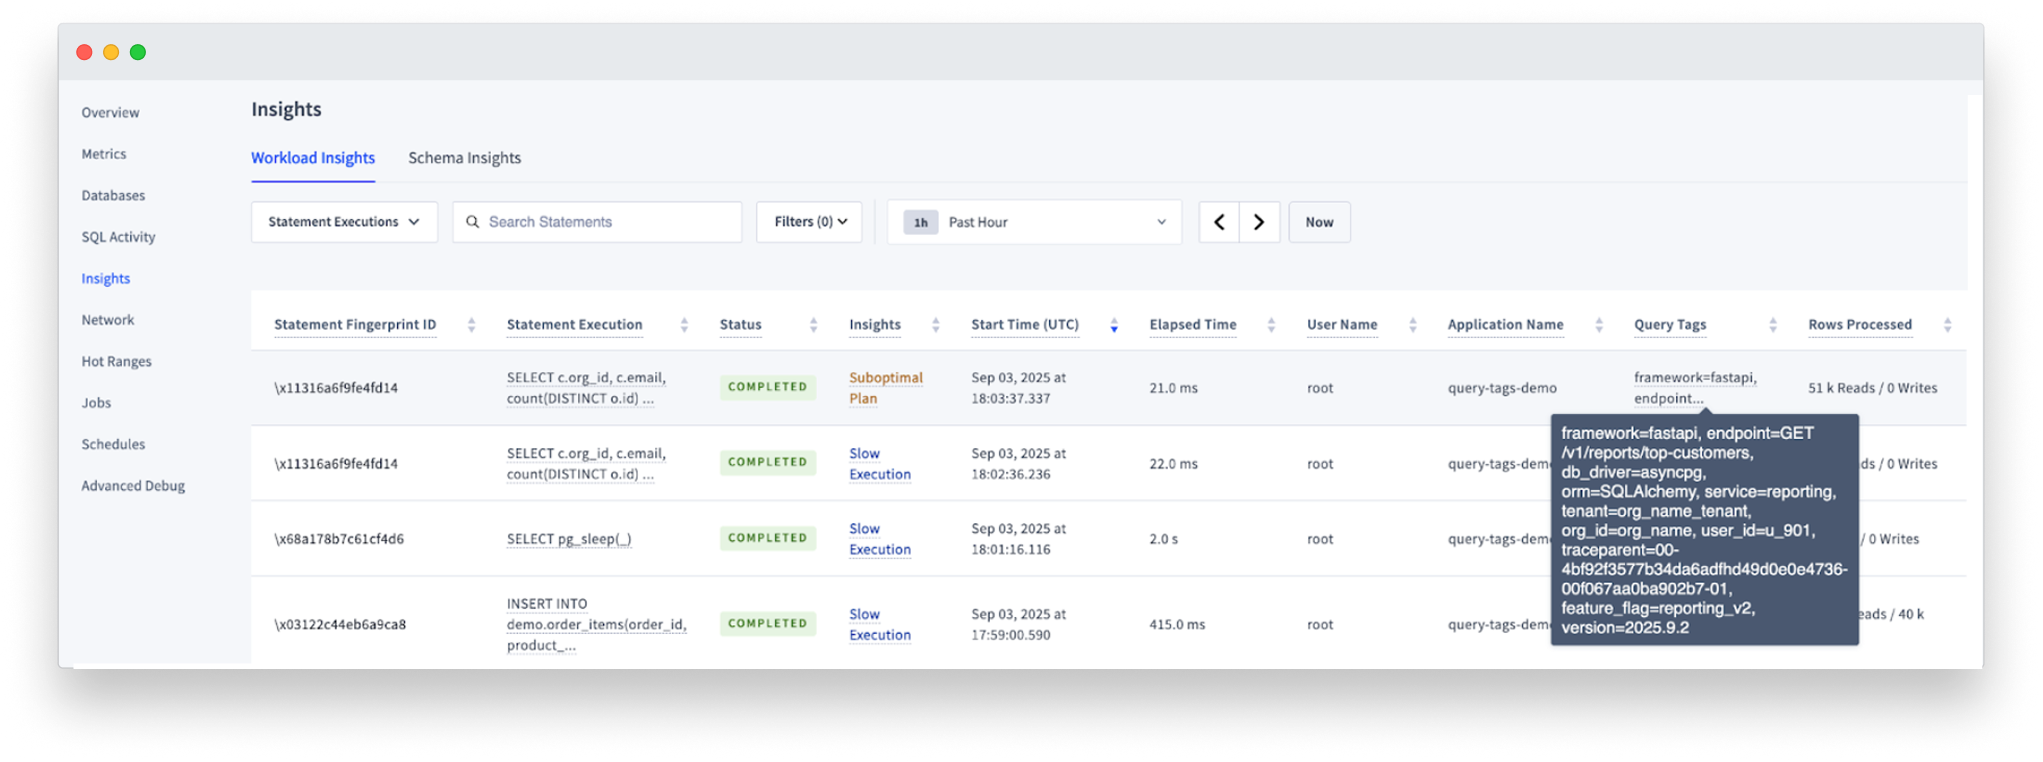
Console – The Statement Insights view includes a “Query Tags” column, making it easy to identify problematic queries by tag instead of raw SQL text.
Together, these integrations give operators a complete path to “connect the dots” from anomalous database behavior back to the application component or user action that caused it:
Once enabled, CockroachDB automatically captures and displays tags. The tagging format strictly follows the SQLcommenter spec: key=value pairs, URL-encoded as needed and separated by commas. Many libraries and frameworks already handle this formatting for you.
How query tagging works with ORMs and OpenTelemetry tooling
One of the best aspects of adopting the SQLcommenter specification is that many popular object-relational mapping tools (ORMs) and database drivers already support it. This means you can now start tagging queries with minimal effort in your application code. SQLcommenter provides plugins or middleware for a wide range of frameworks and languages including Python’s Django and SQLAlchemy, Java’s Hibernate (and Spring via JDBC), JavaScript/Node’s Knex.js and Sequelize, Ruby on Rails, and more. In most cases, enabling query tagging is as easy as adding a library or flipping a configuration.
For instance, in a Django app you can include the SqlCommenter middleware, or in a Java app enable the Hibernate SqlCommenter module. The ORM will automatically inject comments into every query with metadata like the controller name, action, or other context, with little to no change in your application code. If you aren’t using a supported ORM, you can still add tags manually by following the SQLcommenter specification (essentially adding a comment in the right format). The key benefit is that CockroachDB’s query tagging seamlessly ties into these existing tools, and doesn’t require a rewrite of your application.
Connecting application behavior to database performance
Query tagging in CockroachDB brings a more developer-centric view to database operations, making it easier to troubleshoot and optimize your applications. By leveraging the SQLcommenter standard, we ensure that this capability works with the tools and frameworks you already use, and integrates with modern observability stacks out-of-the-box. Whether you’re running dozens of microservices or a monolithic app, query tags give you a powerful way to correlate what’s happening in your database with what’s happening in your code.
We’re excited to see how our users leverage this feature to gain deeper insights, and build even more reliable, high-performance applications on CockroachDB. To learn more, please visit our query tags docs page.
Try CockroachDB Today
Spin up your first CockroachDB Cloud cluster in minutes. Start with $400 in free credits. Or get a free 30-day trial of CockroachDB Enterprise on self-hosted environments.
Kevin Ngo is a Staff Product Manager for Observability at Cockroach Labs, where he focuses on observability, diagnostics, and supportability for distributed SQL databases. With a decade+ in the data and database space, he works at the intersection of database operations, troubleshooting, and system understanding for both humans and automated systems.